Welcome to Weidong Machines
How to Measure Wood Grinder Throughput: A Practical Site Test
How to Measure Wood Grinder Throughput: A Practical Site Test
A grinder may be advertised with an impressive tons-per-hour range, yet the production seen at a real site can be very different. That does not automatically mean the machine is underperforming. Feedstock size, moisture, contamination, screen choice, loader rhythm, operator decisions and the way working time is counted all change the result.
The useful question is not simply, “How many tons per hour can this grinder process?” It is, “How many acceptable tons can this complete site produce during a repeatable shift, under clearly recorded conditions?”
This guide provides a practical test that biomass yards, land-clearing contractors, wood recyclers and project buyers can use before comparing machines or planning a production line. It works for both tub grinders and horizontal grinders, although the feed method and loader workflow will differ.
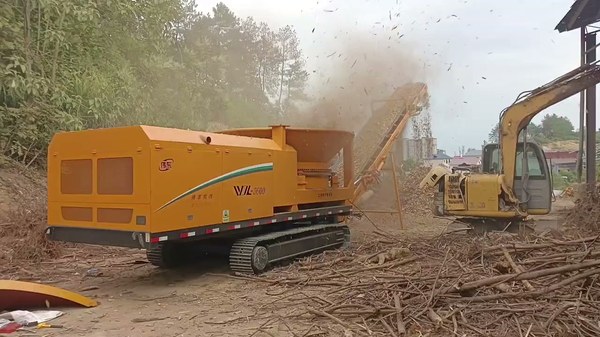
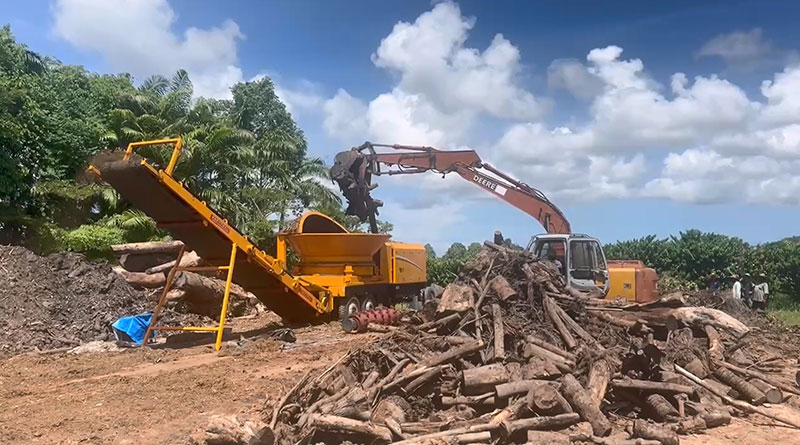
A crawler tub grinder and loader processing forestry residue during a field operation.
Why nameplate capacity is not the same as site throughput
Rated capacity is normally a range because wood waste is not a uniform industrial material. A clean, dry branch pile behaves differently from wet root balls carrying soil. Long trunks feed differently from short bark pieces. A large opening may accept bulky material, but the final production rate still depends on how quickly the material reaches the rotor, passes through the selected screen and leaves the discharge area.
For that reason, capacity should be treated as a system result. The grinder, loader, operator, screen, feed pile, discharge conveyor and downstream truck or stockpile are all part of the test. If the grinder waits for the loader for ten minutes, the site has lost production even though the rotor itself may be capable of more.
Buyers who are still deciding between machine types should first read the difference between a tub grinder and a horizontal grinder. Once the feeding concept is clear, the following method can be used to compare real results.
Define the two throughput numbers before the test
Use two different measurements. Reporting only one number can hide delays or make two tests impossible to compare.
Net grinding throughput measures what the machine produces while it is actively processing material:
Net throughput (t/h) = accepted output mass / productive grinding hours
Productive grinding time includes the periods when material is moving through the grinding process. It excludes planned breaks and clearly documented external delays. This number helps evaluate the grinding setup under the tested feedstock condition.
Gross shift throughput measures what the entire operation delivers during the scheduled test window:
Gross throughput (t/h) = accepted output mass / total elapsed test hours
Elapsed time starts when the test officially begins and ends after the final test material has been processed. It includes loader delays, relocation, cleanout, blockage response and other interruptions. This number is usually more useful for budgets, contracts and daily production planning.
Always report both. A high net rate with a low gross rate signals that the grinder can process quickly but the site workflow is limiting total production.
Step 1: Choose and describe a representative feedstock batch
Do not build the test around the easiest pile in the yard unless that pile represents normal work. Select material that reflects the expected commercial input. Record:
material type, such as branches, roots, bark, pallets, green waste or demolition wood;
approximate maximum and typical dimensions;
visible soil, rock, metal or other contamination;
whether the pile is mixed or source-separated;
moisture condition and, when possible, measured moisture percentage;
how long the material has been stored;
any pre-sorting, cutting or handling completed before the test.
This description matters because the same machine may show different results on different materials. The existing guide to materials a tub grinder can process is a useful starting point, but a site test must describe the actual batch rather than rely on a general material name.
Prepare enough material for at least three stable test runs. A five-minute demonstration can show that a machine works, but it is usually too short to reveal loader delays, heat buildup, screen restriction or changes in material density.
Step 2: Measure input or accepted output by weight
Mass is generally more comparable than loose volume. A cubic meter of fluffy branches can weigh far less than a cubic meter of wet bark or compacted chips. If the project is sold by ton, use certified truck scales, loader scales or another calibrated weighing method whenever possible.
There are two practical approaches:
Weigh the prepared input batch, then subtract rejected contamination and unprocessed material.
Weigh the accepted finished output after removing oversize material that must be reprocessed.
The second approach is often stronger because it measures what the customer can actually use or sell. Record the measurement method and scale resolution. Do not mix scale data from one run with visual volume estimates from another.
If the business must work in cubic volume, record bulk density samples so volume can be converted carefully. Fill a known-volume container without artificial compression, weigh it, repeat the sample at least three times and report the average density together with the range. Never present a volume-to-mass conversion as universal for all wood waste.
Before comparing supplier capacity figures, use the wood grinder capacity estimation guide to identify the feedstock, sizing and workflow variables that should be documented alongside the measured result.
Step 3: Fix the machine configuration
Record the configuration before starting:
grinder model and power source;
screen or sizing setup;
cutting or hammer configuration;
feed control settings;
discharge conveyor arrangement;
relevant wear-part condition;
loader model, bucket or grapple type and number of support operators.
Do not change a screen or feed setting halfway through a run without ending that run and starting a new record. Otherwise, the result combines two configurations and cannot be reproduced.
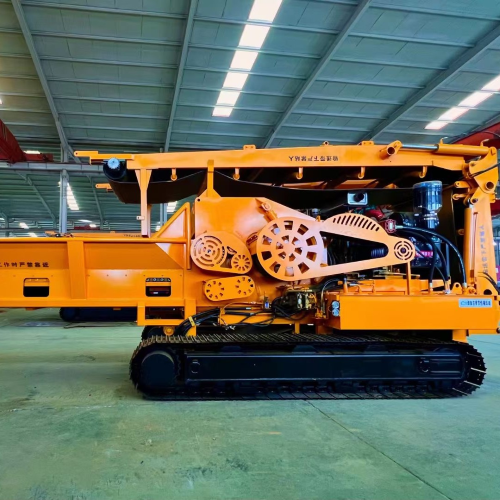
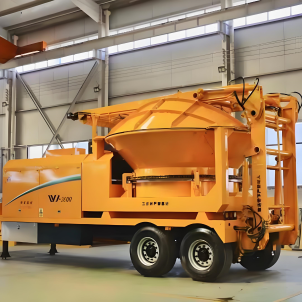
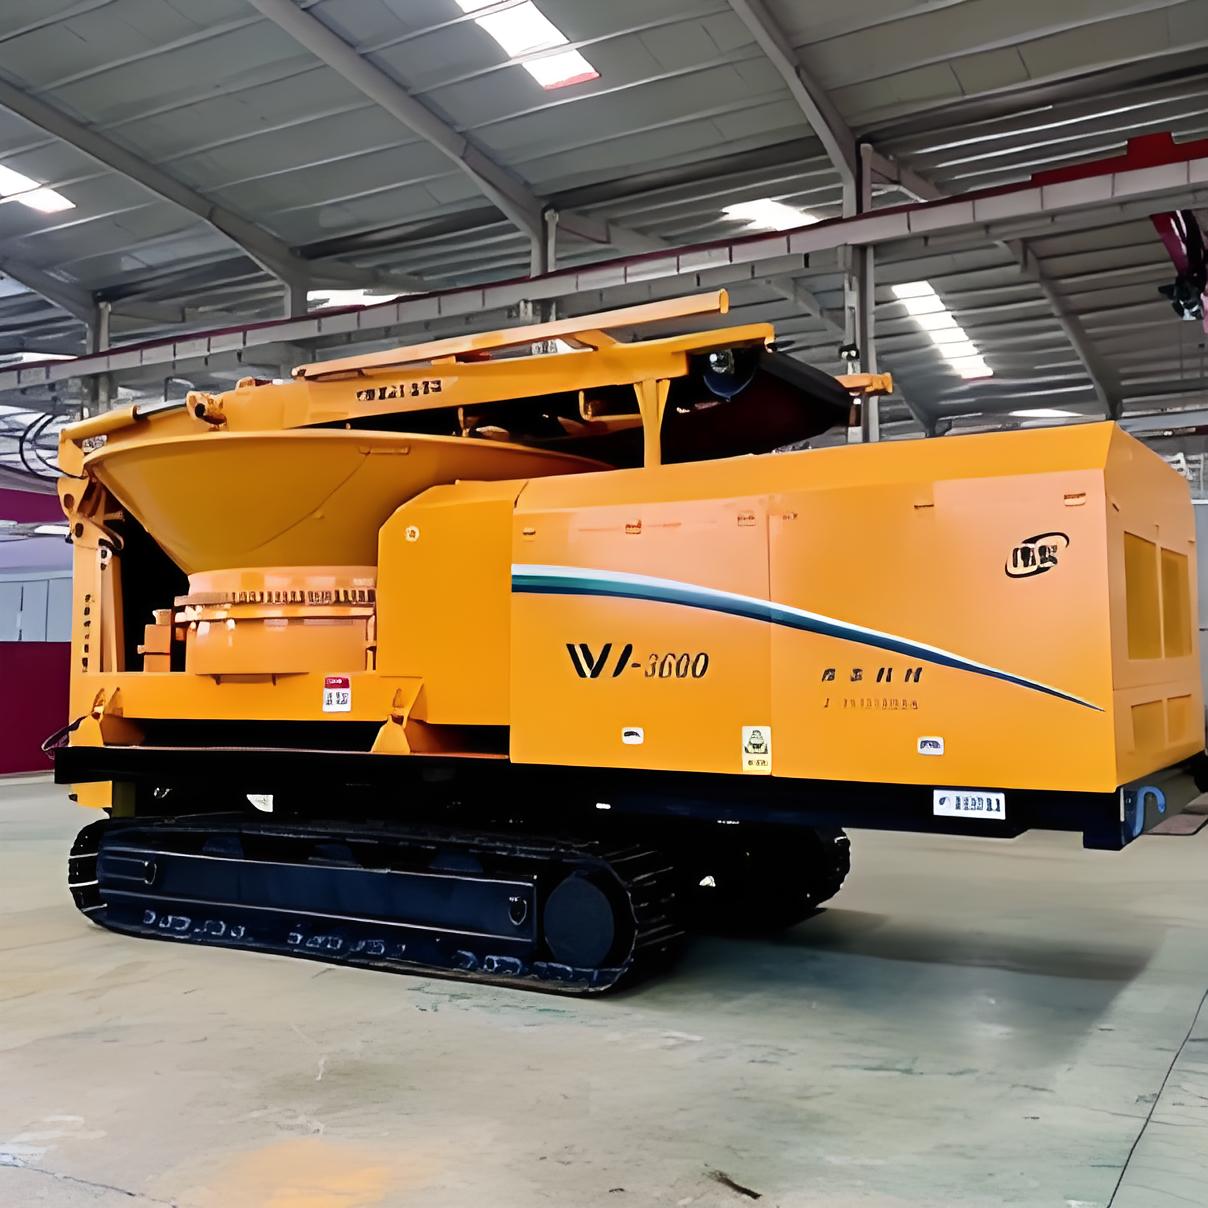
For a tub grinder test, also record whether the site uses a trailer or crawler arrangement and whether relocation is part of the normal cycle. Product pages for the WD3600T trailer tub grinder and WD3600C crawler tub grinder illustrate why chassis and site movement should be documented separately from grinding capacity.
Step 4: Establish timing rules
Assign one person as the test recorder. Use a synchronized clock and divide time into clear categories:
active grinding;
normal loading gap;
grinder adjustment;
blockage or contamination stop;
maintenance or inspection;
relocation;
discharge or truck delay;
planned break;
other external delay.
The recorder should write the start and stop time for every delay longer than an agreed threshold, such as one minute. The exact threshold is less important than applying it consistently across all runs.
Do not stop the clock simply because production becomes slow. Slow feeding is part of the observed performance. Stop or reclassify time only according to the rules written before the test.
Step 5: Run three comparable batches
Start with normal operating procedures and all required safety controls. The test must never encourage faster feeding at the expense of safe operation, contamination checks or manufacturer instructions.
For each batch, record the prepared mass, accepted output mass, start time, end time, active grinding minutes and every delay category. Also note visible changes in feedstock. If the first batch contains dry branches and the third contains wet roots, they should not be averaged without clearly labeling the difference.
Three runs help reveal variation. Report the result of each run, the average and the range. A single peak rate is not a reliable production promise. A slightly lower but repeatable rate is more useful for planning trucks, labor and downstream equipment.
Step 6: Check output quality, not only output weight
Throughput is valuable only when the output meets its intended use. Record:
target particle size;
approximate percentage within specification;
oversize material requiring another pass;
visible fines;
contamination remaining in the product;
downstream acceptance or rejection criteria.
If 30 tons leave the conveyor but five tons must be ground again, the first-pass accepted output is 25 tons, not 30. This distinction prevents a coarse screen from appearing artificially productive when it does not meet the customer’s requirement.
Output requirements should be agreed before the test. Mulch, compost structure material, biomass fuel and pellet-preparation feedstock may need different size distributions. The preferred configuration is the one that produces acceptable material at a stable rate, not simply the one that moves the most mass.
Step 7: Calculate utilization and identify the bottleneck
Calculate productive utilization:
Utilization (%) = productive grinding time / total elapsed time × 100
Then rank delay categories by total minutes. This shows where the next improvement should be made.
If normal loading gaps dominate, the grinder may be waiting for the loader or the feed pile may be poorly positioned. If discharge delays dominate, the conveyor, stockpile or truck plan may be limiting the site. If blockage time dominates, material preparation, contamination control, screen choice or machine configuration needs review.
Capacity improvement is often cheaper outside the grinder. Moving a feed pile closer, separating contamination earlier or adding the correct loader attachment may raise gross output without changing the engine or rotor.
For an engineering view of the same bottleneck problem, review the five factors that affect wood grinder production capacity, then compare those factors with the delay categories recorded in this test.
A simple site-test record
Use one row for every run:
| Field | Run 1 | Run 2 | Run 3 |
|---|---|---|---|
| Feedstock description | |||
| Moisture condition | |||
| Prepared input mass | |||
| Accepted output mass | |||
| Total elapsed minutes | |||
| Productive grinding minutes | |||
| Loader delay minutes | |||
| Blockage/inspection minutes | |||
| Discharge delay minutes | |||
| Net throughput (t/h) | |||
| Gross throughput (t/h) | |||
| Output within specification |
Attach photos of the input pile, typical pieces, screen/configuration and finished output. These records make later comparison far more credible than an isolated capacity claim.
How to use the results for a purchase or project decision
First, compare gross throughput with the required daily tonnage. Add realistic time for shift changes, fueling, inspections and scheduled maintenance. Second, compare output quality with the downstream specification. Third, use actual fuel or electricity consumed during the test to estimate energy cost per accepted ton.
Operating economics should be calculated per accepted ton, not only per engine hour. The site’s existing tub grinder operating-cost guide explains the main cost categories. Combining those categories with a measured gross throughput produces a much stronger project model.
A separate tub grinder operating-cost breakdown provides another worksheet-oriented view of fuel, wear parts, labor, maintenance and downtime; replace any example assumptions with the measurements from your own site.
Finally, keep the test sheet as a baseline. Repeat the same method after changing the screen, loader workflow, feedstock preparation or stockpile layout. Change one major variable at a time whenever possible. That is how a site learns whether an improvement is real.
Conclusion
Real wood grinder throughput is not one number copied from a brochure. It is a measured relationship between acceptable output, feedstock condition, machine configuration and the complete site workflow.
A good test reports net grinding throughput, gross shift throughput, utilization, delay causes and output quality. It uses representative material, reliable weight data and at least three comparable runs. With those records, buyers can compare configurations fairly, operators can locate bottlenecks, and managers can build a more dependable cost-per-ton forecast.
If you are planning a material test, prepare photos, typical dimensions, moisture information, contamination risks, target particle size and required daily output before requesting a configuration review. WDMachines can then discuss the test conditions and suitable grinder arrangement using the same measurable criteria.